Data Analysis Is Not About Tools, It Is About Reading a Business Through Its Data
Learn how to think like a data analyst by turning raw business data into real decisions. A step by step guide to asking the right business questions, defining metrics, spotting patterns, and driving action from data.
Table of Contents
Data Analysis Is Not About Tools, It Is About Reading a Business Through Its Data
A Shift in Thinking
Most people think data analysis means learning to use certain tools, writing code, building charts, or running queries. But the real shift that turns someone into a genuine business analyst happens somewhere else entirely. It happens when you stop asking "what is in the data?" and start asking "what is happening in the business?"
Once you make that shift, you are no longer just learning data. You are learning how to read a business through data. That is a completely different skill, and it is far more valuable than knowing the syntax of any particular tool.
The Core Idea
Every dataset is a story of business behavior. Somewhere inside those rows and columns, real events happened, real customers made decisions, and real money moved around. Your job as an analyst is to reconstruct that story from the data left behind.
This flow is the mental model behind every good piece of data analysis. Let's walk through each step in detail.
Step 1: What Does This Dataset Actually Represent?
Before you touch a single formula or write a single line of code, you must answer one question first: what real world process created this data?
Consider a simple dataset like this one.
| OrderID | Customer | Product | Price | Date |
|---|
At first glance, this looks like just a table. But it is not simply a table, it is a record of purchases made by customers over time. That distinction matters enormously, because it reframes everything that follows. You are not analyzing rows, you are studying customer behavior captured through purchases. That reframing is your true starting point.
Step 2: Ask Business Questions, Not Code Questions
Here is a mistake beginners make constantly. They open the dataset and immediately start thinking in terms of groupby operations, filters, and charts. That is backwards. Before any of that, you need to start with genuine business questions.
Notice that none of these questions mention a single tool or technique. They are simply the kinds of questions a curious business owner would ask if they were staring at their own sales data. That is exactly the mindset you want to build.
Step 3: Turn Questions into Metrics
Once you have real business questions, the next step is translating them into measurable things, otherwise known as metrics. This is where vague curiosity turns into something you can actually calculate and track.
For example, the question "how is the business performing?" becomes a set of concrete metrics: total revenue, total orders, and average order value.
The question "who are our best customers?" becomes metrics like total spending per customer, number of orders per customer, and recency, meaning how recently each customer made their last purchase.
The question "is the business growing?" becomes metrics like revenue by month, order count by month, and growth rate expressed as a percentage change over time.
This translation step is one of the most underrated skills in all of analytics. Anyone can ask "is the business growing," but turning that vague question into a small set of clean, trackable numbers is what separates a real analyst from someone just poking around in a spreadsheet.
Step 4: Look for Patterns
This is the part where analysts genuinely live. It is not about calculating numbers for the sake of it, it is about exploring the data to discover something meaningful. There are a handful of pattern types worth actively hunting for every single time you look at a dataset.
Trend simply asks whether something is increasing or decreasing over time. If revenue is climbing month after month, that is a trend showing genuine growth.
Seasonality asks whether behavior repeats in a predictable cycle. Sales spiking every December around the holidays is a classic example of seasonality.
Concentration is one of the most important and often overlooked patterns of all. It asks whether the business is quietly dependent on a small group. A common example is when eighty percent of revenue comes from just ten percent of customers, a situation that looks healthy on the surface but is actually fragile underneath.
Outliers are the unusual, unexpected data points, things like a single customer spending ten times more than everyone else, a product suddenly exploding in sales for no obvious reason, or a sudden drop in transactions that deserves investigation.
Relationships ask whether one thing seems to affect another. For instance, advertising spend going up might correlate with sales going up, or increasing discounts might raise the number of orders while simultaneously lowering overall revenue.
Step 5: Interpret What You Found
This is genuinely the real skill in data analysis, and it is where most people stop short. Most people find a pattern, build a chart, and call it done. A real analyst goes one step further and asks: what does this actually mean for the business?
Consider a simple finding: revenue increased twenty percent last month. A weak, shallow analysis simply says "revenue increased" and moves on. A strong, genuinely useful analysis digs deeper and explains it properly: revenue increased because Product A sales doubled following a discount campaign, but profit margin actually decreased at the same time, which means this particular growth may not be sustainable in the long run.
Notice the difference. The first version is just an observation. The second version is an actual insight, because it connects the number to a cause and flags a risk that the business genuinely needs to know about.
Step 6: Think in Terms of Business Decisions
Every piece of real analysis must eventually lead somewhere, and that somewhere is a decision. If your analysis does not point toward some kind of action, it is simply incomplete, no matter how polished the chart looks.
Ask yourself questions like these once you have your interpretation in hand. Should the business invest more in this particular product? Should it fix a customer drop off problem before it gets worse? Should prices go up? Should costs be reduced somewhere specific? Should a new feature get built? Should something even be pulled off the shelves entirely?
Walking Through a Real Example: The Coffee Shop
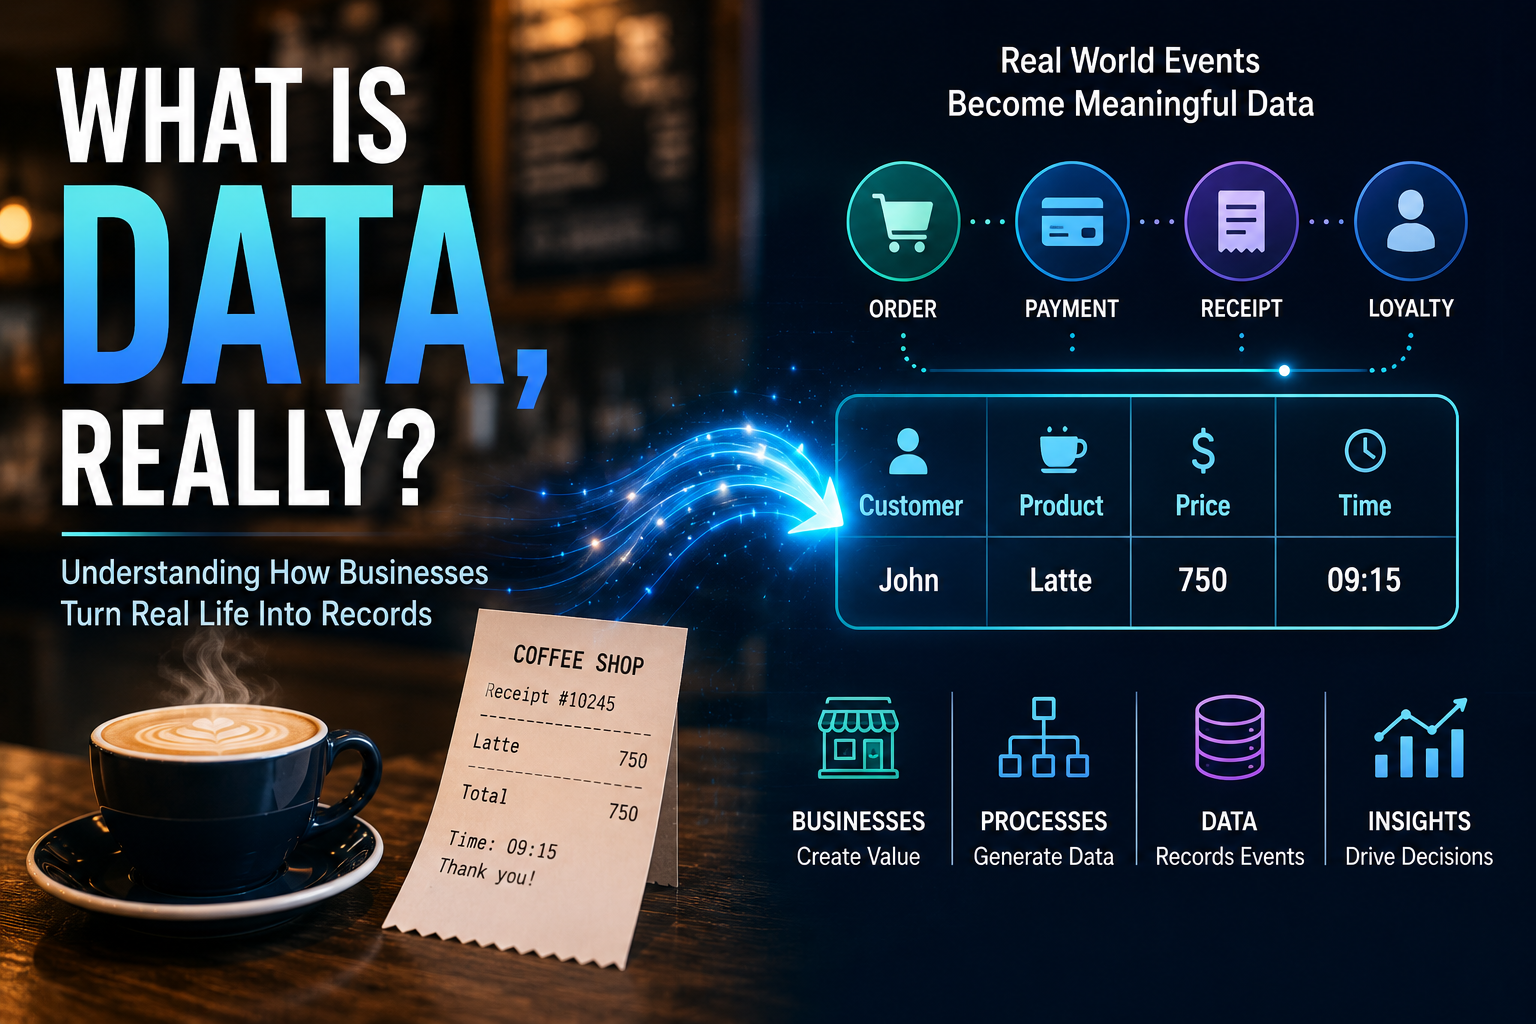
Let's tie this entire process together using a familiar example, a coffee shop, and walk through every step using an imaginary dataset that simply tracks date, customer, product, and price for each coffee sold.
What is this dataset? It is a record of coffee purchases made over time, nothing more complicated than that.
What questions come to mind? How much coffee is sold daily? Which drinks are the most popular? Who are the regular, repeat customers? Are weekends noticeably stronger than weekdays?
What metrics would answer those questions? Daily revenue, orders per day, a ranked list of top selling products, and a count of repeat customers.
What patterns show up once you dig in? Suppose you discover that latte accounts for sixty percent of all sales, which signals a dependency risk if that single drink ever falls out of favor. You also notice weekend sales are double weekday sales, hinting at a possible staffing issue. And you find that just twenty percent of customers are generating eighty percent of total revenue.
What do these patterns actually mean? The business is leaning heavily on one single drink, which is risky, and it genuinely needs to diversify its product line. There is also a clear staffing gap on weekends that needs addressing. And the heavy reliance on a small group of loyal customers means retaining them should be treated as a top priority.
What decisions come out of this? Introduce new drinks to reduce the dependency on lattes alone. Optimize the staffing schedule so weekends are properly covered. Create a loyalty program specifically designed to keep those high value repeat customers coming back.
What Data Analysis Actually Is
It is worth being very clear about something here. Data analysis is not Pandas. It is not building charts. It is not writing SQL queries. Those are simply tools you might use along the way. The real definition of data analysis is turning raw business data into decisions.
A good analyst is not just a coder, and not just a machine learning engineer either. A good analyst is something more valuable than either of those roles on their own: a translator between raw data and real business decisions. That translation skill, connecting numbers to meaning and meaning to action, is what makes analysis genuinely useful to any organization, and it is a skill that stays valuable no matter how much the underlying tools and technologies continue to change.
Summary
Every time you sit down with a dataset, the same six steps of thinking apply, regardless of the industry or the tools involved.
1. Understand what the dataset actually represents, meaning the real world business process that created it.
2. Ask genuine business questions first, about revenue, customers, products, and time, before touching any code.
3. Turn those questions into clear, measurable metrics that can actually be tracked.
4. Look for patterns in the data, including trends, seasonality, concentration, outliers, and relationships.
5. Interpret what those patterns actually mean for the business, not just what they show on a chart.
6. Translate that interpretation into a concrete business decision or recommended action.
Master this sequence, and you will start reading any dataset the way an experienced analyst does, as a story about business behavior rather than a collection of rows and columns.