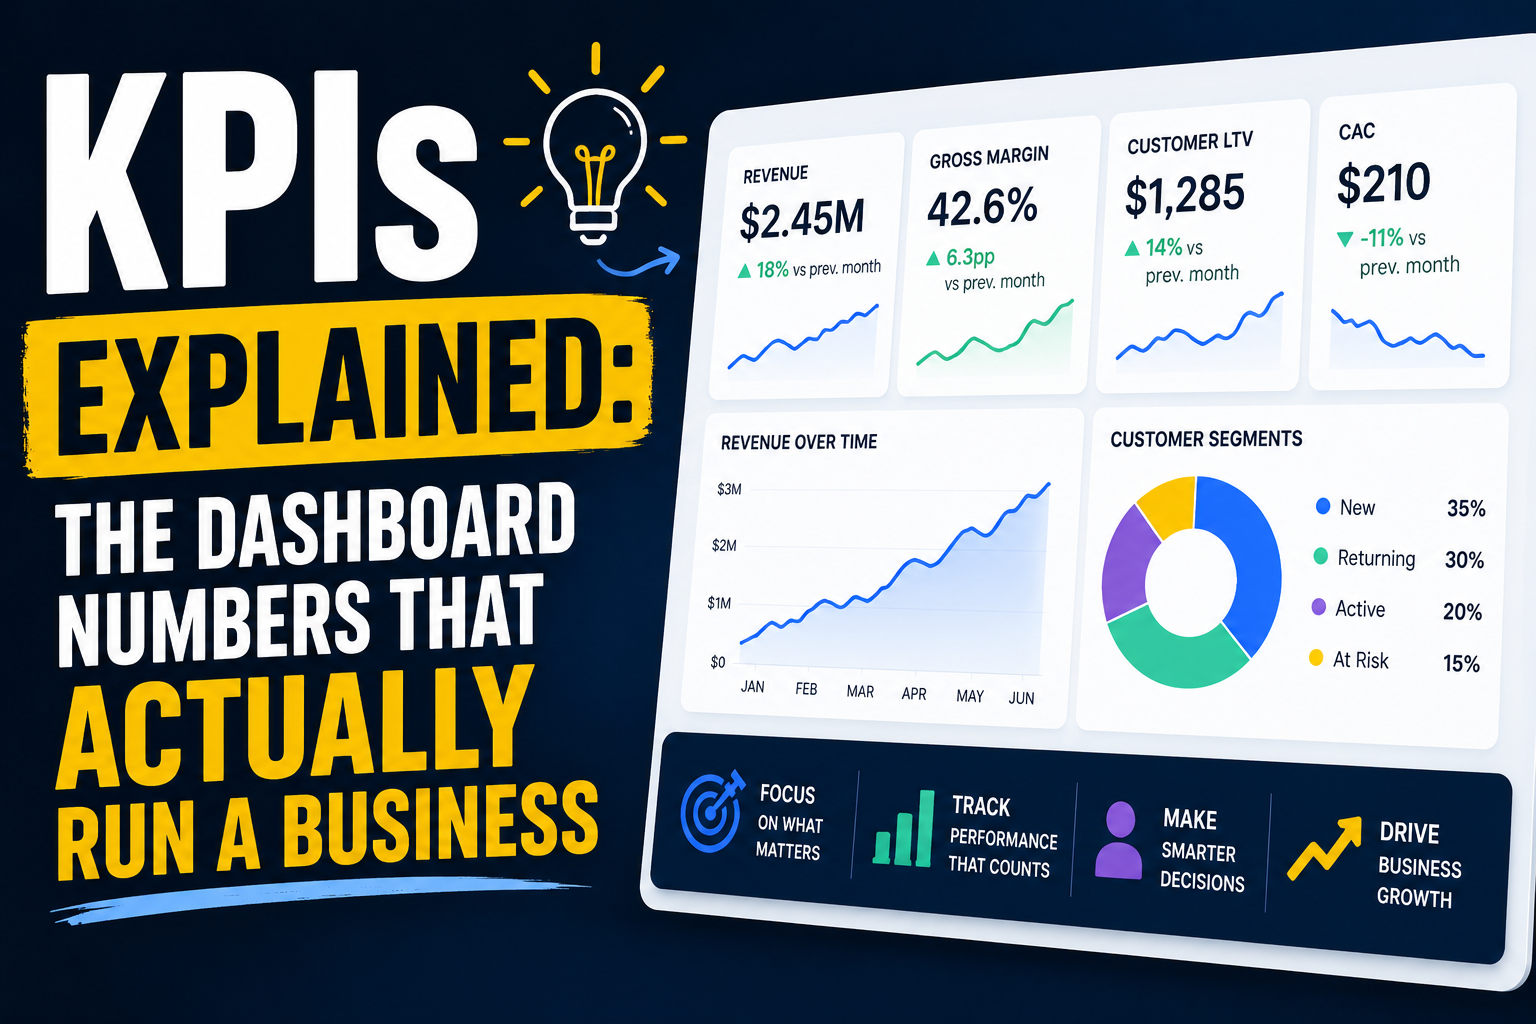
KPIs Explained: The Dashboard Numbers That Actually Run a Business
Understand the KPIs that actually run a business, revenue, profit, churn, CAC, CLV, and more, each with the question it answers and the exact math behind the calculation.
Table of Contents
What Do You Want to Know First Thing in the Morning?
Imagine you are the CEO of a company. When you wake up and check on your business, you do not want every single detail. You do not need to see every visitor, every click, or every line of every transaction. You just want the handful of numbers that tell you whether the business is healthy. Those numbers are called KPIs.
A KPI, short for Key Performance Indicator, is a measurable value that tells you how well the business is achieving an important objective. Think of KPIs as the dashboard of a business, in exactly the same way a car has a dashboard.
Think of It Like Driving a Car
When you are driving, you do not monitor every single sensor in the vehicle. You mainly glance at a handful of things: speed, fuel level, engine temperature, and any warning lights. Those are essentially your car's KPIs.
If the fuel gets low, you stop for gas. If the engine overheats, you stop driving immediately. You make real decisions based purely on those few indicators, without needing to understand every mechanical detail happening under the hood. A business runs on exactly the same principle.
Not Every Metric Is a KPI
This distinction matters more than it might seem at first. Suppose your website has fifty thousand visitors, two thousand products listed, blue colored buttons, and a staff of one hundred and twenty employees. Are any of these KPIs? Not necessarily.
A true KPI must help answer one specific question: are we succeeding? A number that does not connect back to that question is just trivia, not a KPI.
Here is a good example of why raw numbers alone can be misleading. Look at these two months for an online store.
| Month | Visitors | Sales |
|---|---|---|
| Month 1 | 100,000 | 50 |
| Month 2 | 20,000 | 500 |
Month 1 had far more visitors. Month 2 had far fewer visitors but ten times more sales. Which month was actually better for the business? Month 2, clearly. Visitor count on its own tells you almost nothing useful here. The real KPI worth watching is conversion rate, the percentage of visitors who actually become paying customers, not the raw visitor count by itself.
Different Businesses Care About Different KPIs
This is where genuine business understanding becomes essential. A coffee shop does not track the same numbers as a streaming service, and neither of them tracks the same numbers as a hospital.
Notice the pattern here. Every single KPI directly reflects what that particular business is actually trying to achieve. A hospital does not care about monthly recurring revenue, and a SaaS company does not care about bed occupancy. The KPI always follows the goal, never the other way around.
The Most Common Business KPIs
There are a handful of KPIs that show up again and again across almost every kind of business, so it is worth understanding each one properly.
1. Revenue
Question it answers: How much money did customers pay us?
Revenue is simply the total money earned from sales, before anything is subtracted. It is usually the first number anyone looks at, even though it is far from the only number that matters.
Revenue = Total money earned from sales2. Profit
Question it answers: Did we actually make money?
Profit is what remains after every expense has been paid. A business can have enormous revenue and still barely turn a profit, which is exactly why the two numbers are always tracked separately.
Profit = Revenue − Expenses3. Gross Margin
Question it answers: How much money is left after covering the direct cost of what we sold?
Product sells for       = Rs. 100
Cost to make product    = Rs. 60
-----------------------------------
Gross Margin            = Rs. 40
Gross margin is especially useful for comparing different products or checking whether your pricing genuinely covers your production costs.
4. Average Order Value (AOV)
Question it answers: How much does the average customer spend per purchase?
Orders               = 100
Total Revenue         = Rs. 500,000
-----------------------------------
AOV = Revenue ÷ Orders
AOV = 500,000 ÷ 100
AOV = Rs. 5,000
Businesses often try to raise this number by bundling products together or suggesting complementary items at checkout.
5. Customer Acquisition Cost (CAC)
Question it answers: How much does it cost to acquire one new customer?
Marketing Spend        = Rs. 100,000
New Customers Gained    = 200
-----------------------------------
CAC = Marketing Spend ÷ New Customers
CAC = 100,000 ÷ 200
CAC = Rs. 500
6. Customer Lifetime Value (CLV)
Question it answers: How valuable is this customer across the entire relationship, not just their first purchase?
Monthly Spend           = Rs. 2,000
Months as a Customer     = 24
-----------------------------------
CLV = Monthly Spend × Months
CLV = 2,000 × 24
CLV = Rs. 48,000
7. Churn Rate
Question it answers: How many customers are leaving us?
Customers at Start of Month = 1,000
Customers Lost               = 50
-----------------------------------
Churn Rate = Customers Lost ÷ Customers at Start
Churn Rate = 50 ÷ 1,000
Churn Rate = 5%
Predicting and reducing churn happens to be one of the biggest and most valuable applications of AI in business today.
8. Conversion Rate
Question it answers: How many visitors actually become paying customers?
Website Visitors   = 10,000
Purchases Made      = 200
-----------------------------------
Conversion Rate = Purchases ÷ Visitors
Conversion Rate = 200 ÷ 10,000
Conversion Rate = 2%
KPIs Drive the Right Questions
Imagine a CEO opens their dashboard one morning and sees something like this.
| KPI | Status |
|---|---|
| Revenue | Rising |
| Profit | Falling |
| Churn | Rising |
| Conversion | Falling |
Immediately, real questions start forming. Why is profit falling even though revenue is rising? Why are customers leaving at a higher rate than before? Why aren't visitors converting into buyers the way they used to? These questions are exactly what turn into actual data analysis work. A dashboard full of KPIs is not the end of the process, it is the starting point that tells analysts and engineers where to dig.
This Is Exactly Where AI Comes In
Suppose churn starts rising. Traditional analysis simply asks why. Business focused AI thinking goes a step further and asks a much more useful question: can we predict who is likely to churn before they actually leave? That second question is what turns a business problem into a genuine machine learning problem.
Notice where machine learning actually sits in that sequence. It is not the starting point at all, it is one of the later steps. The KPI is what starts everything.
The Right Mindset Around Business AI
Whenever someone says "we need AI," the correct first response should never be "let's build a model." The correct first response should be: which KPI are we actually trying to improve? AI is a tool for improving real business outcomes, it is not a goal in itself. Losing sight of that distinction is exactly how companies end up building technically impressive systems that never actually move the numbers that matter.