What Is Data, Really? Understanding How Businesses Turn Real Life Into Records
Discover what data really is and how businesses generate it every day. A simple, visual guide to structured vs unstructured data, records, fields, entities, and relationships, explained through real business examples.
Table of Contents
Understanding How Businesses Turn Real Life Into Records
Forget AI for a Moment
Imagine you get hired by a company tomorrow. On your first day, the CEO does not hand you a machine learning model or a fancy algorithm. Instead, they hand you something far more basic: their business data.
Here is the problem though. If you do not understand what that data actually represents, you cannot build anything useful with it, no matter how skilled you are at coding or machine learning. Before you can build AI systems, you first need to understand what data actually is and where it comes from. That is exactly where we are going to start.
What Is Data?
Most people, if you ask them, will say something like "data is information." That answer is not wrong, but it is not very useful either. It does not really tell you anything you can act on.
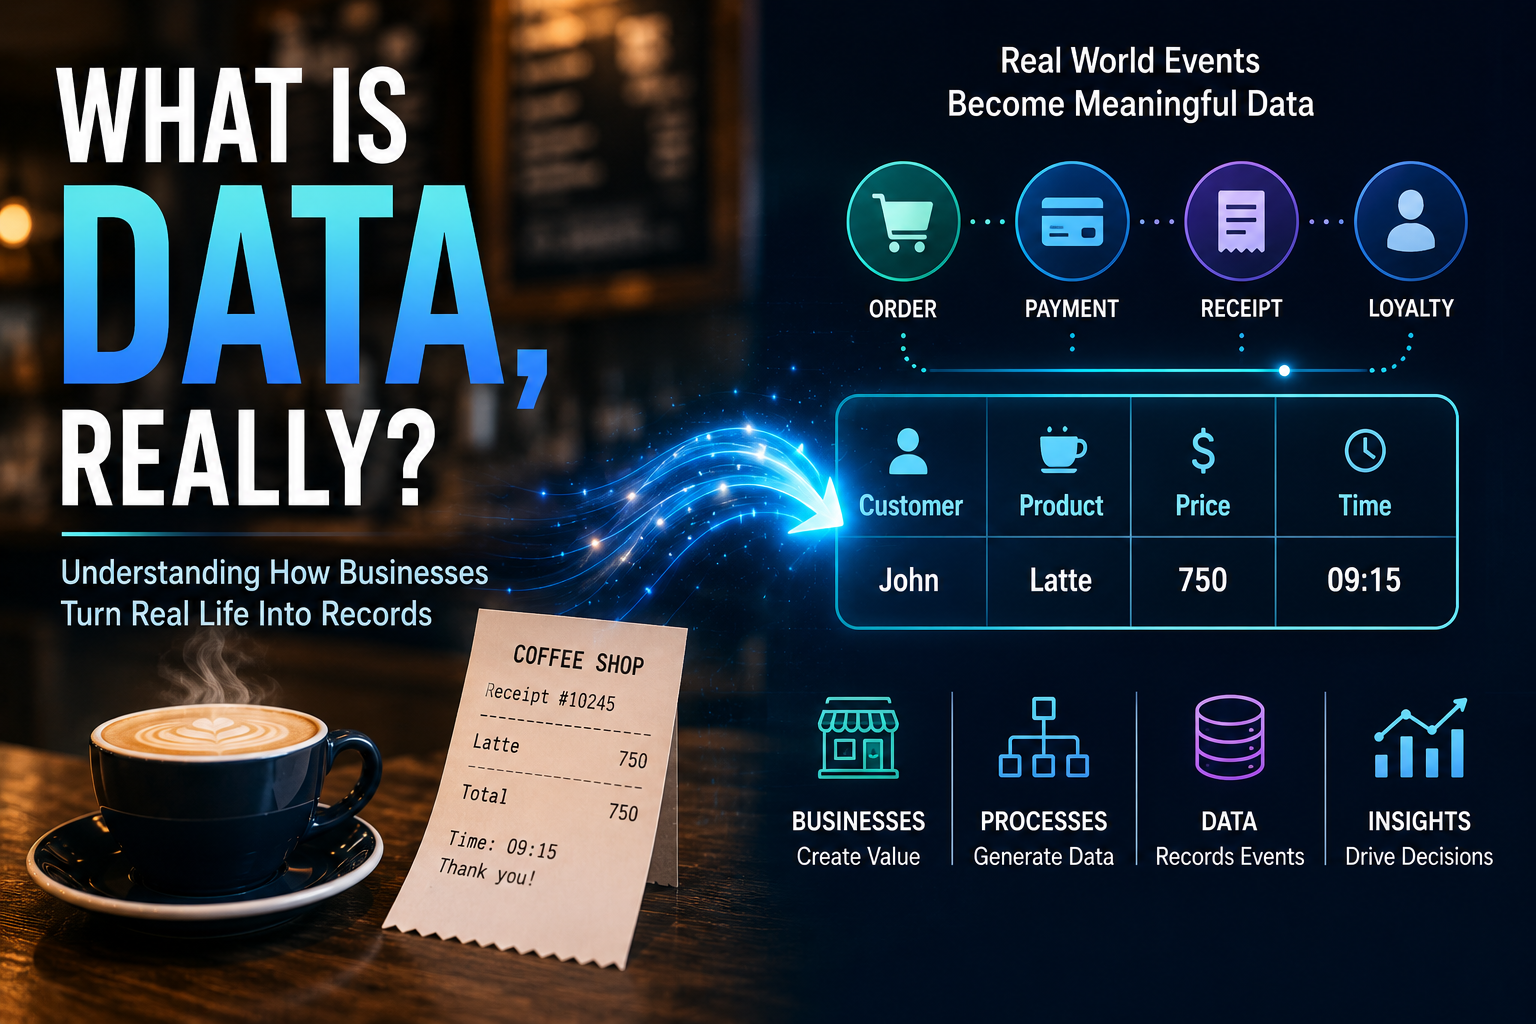
A much better way to think about it is this: data is a digital representation of something that happened in the real world. Data is not the event itself, it is a record of that event.
The purchase happened in reality. The table below is not the purchase itself, it is simply a record describing that the purchase happened.
| Customer | Product | Price | Time |
|---|---|---|---|
| John | Latte | 750 | 09:15 |
Here is another example. In the real world, a student registers for a course. That is the event.
Once again, notice that the data is not the event. It describes the event.
Businesses Do Not Sell Data
This is an important mindset shift, and it trips up a lot of people who are new to working with data. Businesses exist to create value, and while they do that, they naturally generate data as a byproduct. The data is not the point, it is a trail left behind by real activity.
Think about a coffee shop again. A customer orders coffee, and that single action sets off a whole chain of activity inside the shop.
Every single one of those steps creates data. An order gets created. A payment gets received. An employee serves the customer. A receipt gets printed. Inventory quietly decreases behind the scenes. The customer might even earn loyalty points. None of this data is being collected just for the sake of collecting it. The business is simply recording what actually happened as it goes about its normal operations.
Everything in a Business Creates Data
Let's take a slightly bigger example, an online store, and follow one customer's journey from start to finish.
Every single arrow in that diagram creates a piece of data. Now imagine that instead of one customer, you have one million customers all going through similar journeys. Suddenly you are not looking at a handful of records anymore, you are looking at billions of them. This is exactly how large companies end up sitting on enormous amounts of data without ever "trying" to collect it. It simply accumulates as a natural side effect of doing business at scale.
Data Represents Business Processes
This is one of the most important ideas you will ever learn about working with data, so it is worth slowing down on. Businesses run on processes. Processes generate data. If you understand the process, you can understand the data, and if you only look at the data without understanding the process behind it, you will constantly misinterpret what you are seeing.
Take a hiring process as an example. A candidate applies for a job, goes through an interview, receives an offer, and eventually gets hired.
That whole sequence of steps generates data that might look something like this.
| Candidate | Interview Date | Status |
|---|---|---|
| Sarah | July 2 | Passed |
Now take a completely different example, a hospital. A patient arrives, a doctor examines them, medicine is given, and the patient leaves.
That process generates data that might look like this.
| Patient | Doctor | Diagnosis | Medicine |
|---|
Notice how different these two processes are, hiring versus healthcare, yet the underlying idea is exactly the same. A real world sequence of steps happened, and each step left behind a trace in the form of data. As an AI engineer, you will often find it far more useful to map out a business process first, before you even open the dataset, because the process tells you what the data actually means.
Structured Versus Unstructured Data
One of the most common distinctions you will hear when people talk about data is the difference between structured and unstructured data. Understanding this difference is essential, because it changes how you can actually work with the data.
Structured Data
Structured data fits neatly into rows and columns, much like a spreadsheet. Here is a simple example.
| Customer | Age | City |
|---|---|---|
| John | 28 | Colombo |
Because structured data is so neatly organized, it is easy to search, filter, and analyze using traditional tools. Common examples of structured data include sales records, employee information, bank transactions, inventory logs, and order histories.
Unstructured Data
Unstructured data, on the other hand, does not naturally fit into a table at all. Think about things like emails, PDFs, Word documents, photographs, audio recordings, videos, chat messages, and contracts. All of these contain real information, but that information is not sitting in neat rows and columns.
For example, imagine an email that begins with "Dear Customer, thank you for your purchase." That email is genuinely valuable data. It might tell you something about customer sentiment, a complaint, or a compliment. But it clearly does not belong in a simple table the way a sales record does. This is exactly the kind of situation where technologies like large language models become especially useful, because they are able to read through unstructured text and pull out meaning from it in a way traditional tools never could.
Semi Structured Data
There is also a middle ground between fully structured and fully unstructured data, known as semi structured data. A common example of this is JSON, which might look something like this.
{
  "customer": "John",
  "orders": [
    {
      "product": "Coffee",
      "price": 750
    }
  ]
}
Notice that this data is organized and has a clear structure, but it does not sit in simple rows and columns the way a spreadsheet does. Semi structured formats like this are extremely common in modern systems, especially because APIs frequently exchange information in exactly this format.
Records and Fields
Let's go back to a simple table and use it to understand two more foundational terms, records and fields.
| CustomerID | Name | City |
|---|---|---|
| 1 | John | Colombo |
| 2 | Anne | Kandy |
| 3 | David | Galle |
Each row in this table is called a record. A record represents one specific entity, in this case, one specific customer. John's entire row is one record. Anne's entire row is a separate record. Every row represents a distinct instance of whatever the table is describing.
Each column, on the other hand, is called a field, sometimes also referred to as an attribute. The diagram below shows how one single customer can be described by many different fields at once.
In the table above, CustomerID, Name, and City are all fields, because each one describes some specific piece of information about the customer. All of those fields together build a complete picture of that one customer.
Entities
Businesses do not just store random, disconnected pieces of data. They store organized information about entities. An entity is simply something that matters enough to the business that it is worth keeping track of.
Take a supermarket as an example. A supermarket typically needs to track several entities at once, and each one usually becomes its own table in a database.
Each of these entities represents a distinct kind of "thing" the business cares about and needs to manage separately.
Relationships
Businesses are not made up of isolated pieces of information sitting in separate boxes, they are made up of connected things that interact with each other. Each of these connections is called a relationship.
Understanding relationships like this is absolutely essential, because most real business questions cannot be answered by looking at just one table in isolation, they require combining data from multiple related tables at once.
Why This Matters for AI
Let's bring this all together with a practical example. Suppose a company asks you to predict which customers are likely to stop buying from them. This sounds like a straightforward machine learning problem on the surface, but here is the catch: you cannot build a useful model for this using only a customer table.
To really answer this question, you would also need data about orders, payments, support tickets, website activity, and marketing emails. The accuracy of your prediction depends heavily on the relationships between all of these different datasets, not on any single one of them in isolation. This is exactly why understanding entities and relationships is not just a database design topic, it is a core part of thinking like a business focused AI engineer.
Thinking Like a Business AI Engineer
Whenever someone hands you a dataset, resist the urge to immediately start coding. Instead, slow down and ask yourself a set of important questions first. What real world event does each row in this data represent? What does each column actually describe? What business process created this data in the first place? What entities are involved here? How are those entities connected to one another? And finally, what business decisions could this data actually support?
These questions matter far more than knowing the exact syntax for something like groupby() or merge() in your favorite programming language. Syntax can be looked up in seconds, but a genuine understanding of what your data represents and where it came from is what actually leads to AI systems that solve real business problems instead of just producing technically impressive but ultimately useless results.